
How to Look Up Waukesha County Jail Population Data
There is no single live dashboard that posts the county jail population count by the hour with charts. What the county does publish is the current inmate list, which updates hourly. Counting the roster on a given day gives a real snapshot of who is in custody. For broader numbers, the county budget and the Sheriff's reports add context, and national datasets fill in comparisons.
So a good population lookup blends sources. Read the hourly roster for today's count. Use the county budget for funding and capacity context. Use Bureau of Justice Statistics jail reports for state and national rates. Each source answers a different question, and none of them alone tells the whole story.
- Open the current inmate list on the Sheriff's site to see who is in custody now.
- Count or note the entries to get a same-day population snapshot.
- Compare that count to the 481-bed capacity to gauge how full the jail is.
- Read the latest county budget and Sheriff reports for official figures.
- Use Bureau of Justice Statistics data for the state and national benchmark.
Repeating the roster count on several days is the most reliable do-it-yourself measure, since the county does not post a public trend chart.
Waukesha County Jail Capacity Overview
The firm local number is capacity. The Sheriff's Jail Division states the Waukesha County Jail is a 481-bed maximum-security facility. It holds men and women, both pretrial and sentenced, in a mix of direct and remote supervision pods. The Huber Facility runs work release under the Huber Law, though the county does not publish a fixed Huber bed count in the pages reviewed.
| Facility | Capacity | Population Type |
|---|---|---|
| Waukesha County Jail | 481 beds | Male and female, pretrial and sentenced |
| Huber Facility | Not published | Work release under the Huber Law |
Note: The 481-bed figure is the official capacity, but the actual count on any day comes from the hourly roster, not a fixed number.
Average Daily Population
Average daily population, or ADP, is the mean number of people held over a period. It smooths out the daily ups and downs of the roster. The county pages reviewed did not publish an official ADP figure for the jail, so this guide does not state one. Inventing a number would be worse than leaving it open.
To estimate the trend yourself, read the hourly roster on several days and compare. For an official ADP, watch the county budget documents and any Sheriff or Jail Division reports, which sometimes include population figures tied to funding decisions. The roster count against the 481-bed capacity also shows roughly how full the jail is on a given day.
Keep in mind that ADP and capacity are not the same thing. A jail can run below its bed count on average and still hit crowding on certain days, since arrests and releases are not evenly spread. Weekend bookings, court schedules, and holds can all spike the daily number above the average. That is why a single roster reading is a snapshot, not a trend, and why the average matters more than any one day.
Demographic Breakdown
A demographic breakdown splits the population by age, sex, and race. The county jail holds both men and women, but the official pages reviewed did not publish a detailed demographic table for the jail. So this guide does not present county jail demographics as fact.
For the county as a whole, the U.S. Census QuickFacts page gives population and demographic data, which is useful as the denominator when you think about an incarceration rate per 100,000 residents. Census data is a county population figure, not a jail figure, and the two should never be mixed.
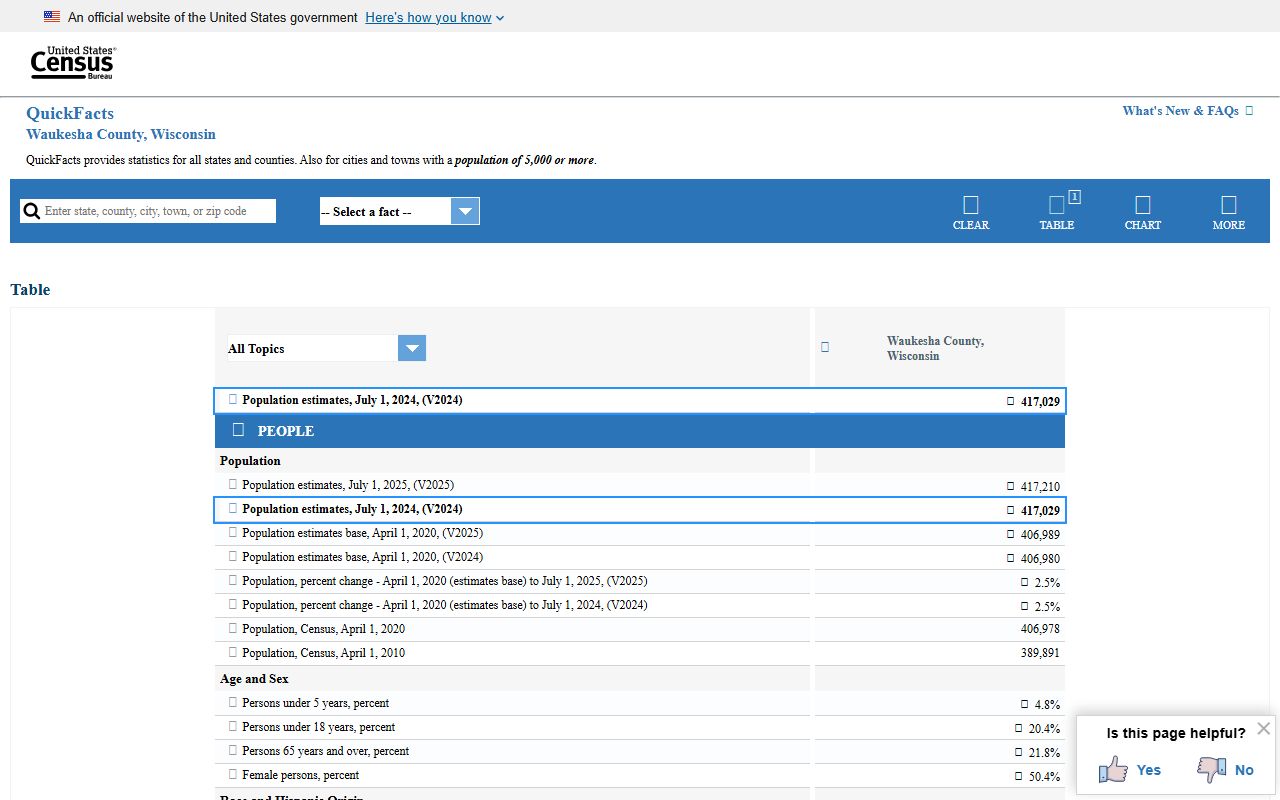
The Census QuickFacts page lists the county population, which the 2025 estimate put near 417,210.
Pretrial vs. Sentenced Population
Jails hold two broad groups. Pretrial detainees are people held while their case is open, often because they have not posted bond. Sentenced inmates are serving a local jail term after a conviction. The Waukesha County Jail holds both, which is why a single roster mixes people at very different stages.
| Group | Who They Are | Status |
|---|---|---|
| Pretrial | Held while a case is open | Not convicted; may post bond |
| Sentenced | Serving a local jail term | Convicted; may qualify for Huber |
The county does not publish a fixed pretrial-to-sentenced ratio in the pages reviewed, so treat the split as a category to understand, not a number to quote.
Misdemeanor vs. Felony Population
People in the jail face charges across the range, from misdemeanors to felonies, plus some held on holds or warrants. The case-type codes you see in court records, CM for misdemeanor and CF for felony, line up with the kinds of cases that bring people into custody. A felony case is more likely to involve a held defendant than a minor misdemeanor.
The county does not publish a charge-type breakdown of the jail population in the reviewed pages. To understand the mix, the better route is the court record, where a name search shows the actual charges and severity. The court records page explains how to read those codes.
Mental Health and Medical Population
Medical and mental health needs are a real part of any jail population, and they carry real cost. The county does not publish a count of inmates with medical or mental health needs, and those details are not public for individuals. What the county has made public is the budget pressure that care creates.
The 2025 county budget news specifically named an increase of more than $1 million in jail medical services to inmates. That figure does not tell you how many people need care, but it shows that medical demand is a significant and growing share of the jail's cost. Suicide watch, protective custody, and individual medical details are never public.
National and State Context
To judge whether a county jail is crowded, people compare an incarceration rate per 100,000 residents across the county, the state, and the nation. The honest challenge is that the county does not publish its own rate, so the comparison has to be built from official sources rather than quoted from one page. The table shows where each level's data lives.
| Level | Where the Data Lives | Notes |
|---|---|---|
| County | Hourly roster, county budget, Sheriff reports | Read the roster against the 481-bed capacity. |
| State | Wisconsin DOC and Bureau of Justice Statistics | State jail and prison figures. |
| National | Bureau of Justice Statistics jail reports | National jail population and rate per 100,000. |
The Bureau of Justice Statistics publishes annual jail figures that set the national benchmark. Pair that with the county roster count and the census population to build a fair comparison, and always label which number is county, state, or national.
Population Trends Over Time
A trend needs more than one snapshot. The reviewed county pages did not publish a five-year jail population table, so this guide does not chart one. What is documented is direction through the budget. The 2025 county budget included Sheriff's Department funding with $2.8 million in new tax levy and $1.5 million in Shared Revenue, in part to relieve jail inmate capacity and to cover rising jail medical costs.
That budget action signals capacity pressure was a real concern heading into 2025. To follow the trend over time, compare roster counts you gather yourself, then read each year's county budget and Sheriff reports for official figures. Avoid sites that claim exact daily counts going back years, since the county itself does not publish that series.
Several forces push a jail count up or down over time. Arrest rates, bond decisions, court backlogs, and the pace of sentencing all move the number. So does Huber participation, since work-release inmates spend part of the day out of the building. A budget that adds funding to relieve capacity, as the 2025 plan did, usually points to a count that was straining the available beds. Reading the budget language is often a better trend signal than any single day's roster.
Searching for Waukesha County Inmate Records by Name
This page covers population data, not individual lookups. To find one person in custody, use the hourly roster on the Waukesha County inmate records page, which is built for name searches and shows the holding facility.
Where the Data Comes From
Clear sourcing keeps this honest. The 481-bed capacity comes from the Sheriff's Jail Division. The daily count comes from the county's hourly current inmate list. The funding and medical-cost figures come from the county's 2025 budget news. The state and national comparisons come from the Wisconsin Department of Corrections and the Bureau of Justice Statistics.
Where a number was not published by the county, this guide says so rather than guessing. That is the right approach for population data, where a wrong figure can mislead more than a missing one. For case-level facts, the court record remains the official source through court records and the live roster.